天然ダムによる河道閉塞が発生するか?まで考えられた文献です。
イタリアと日本全土が検討済みです(著者は中国の方のようです)。LSMを作成した後、川に重ねて河道閉塞リスクを検討されています。道路への影響検討を扱った文献はいくつか見てきましたが、天然ダム形成については初めてです。(3)式がどこまで実態に即しているのかはわかりませんが、一歩進んだ取り組みでしょう。
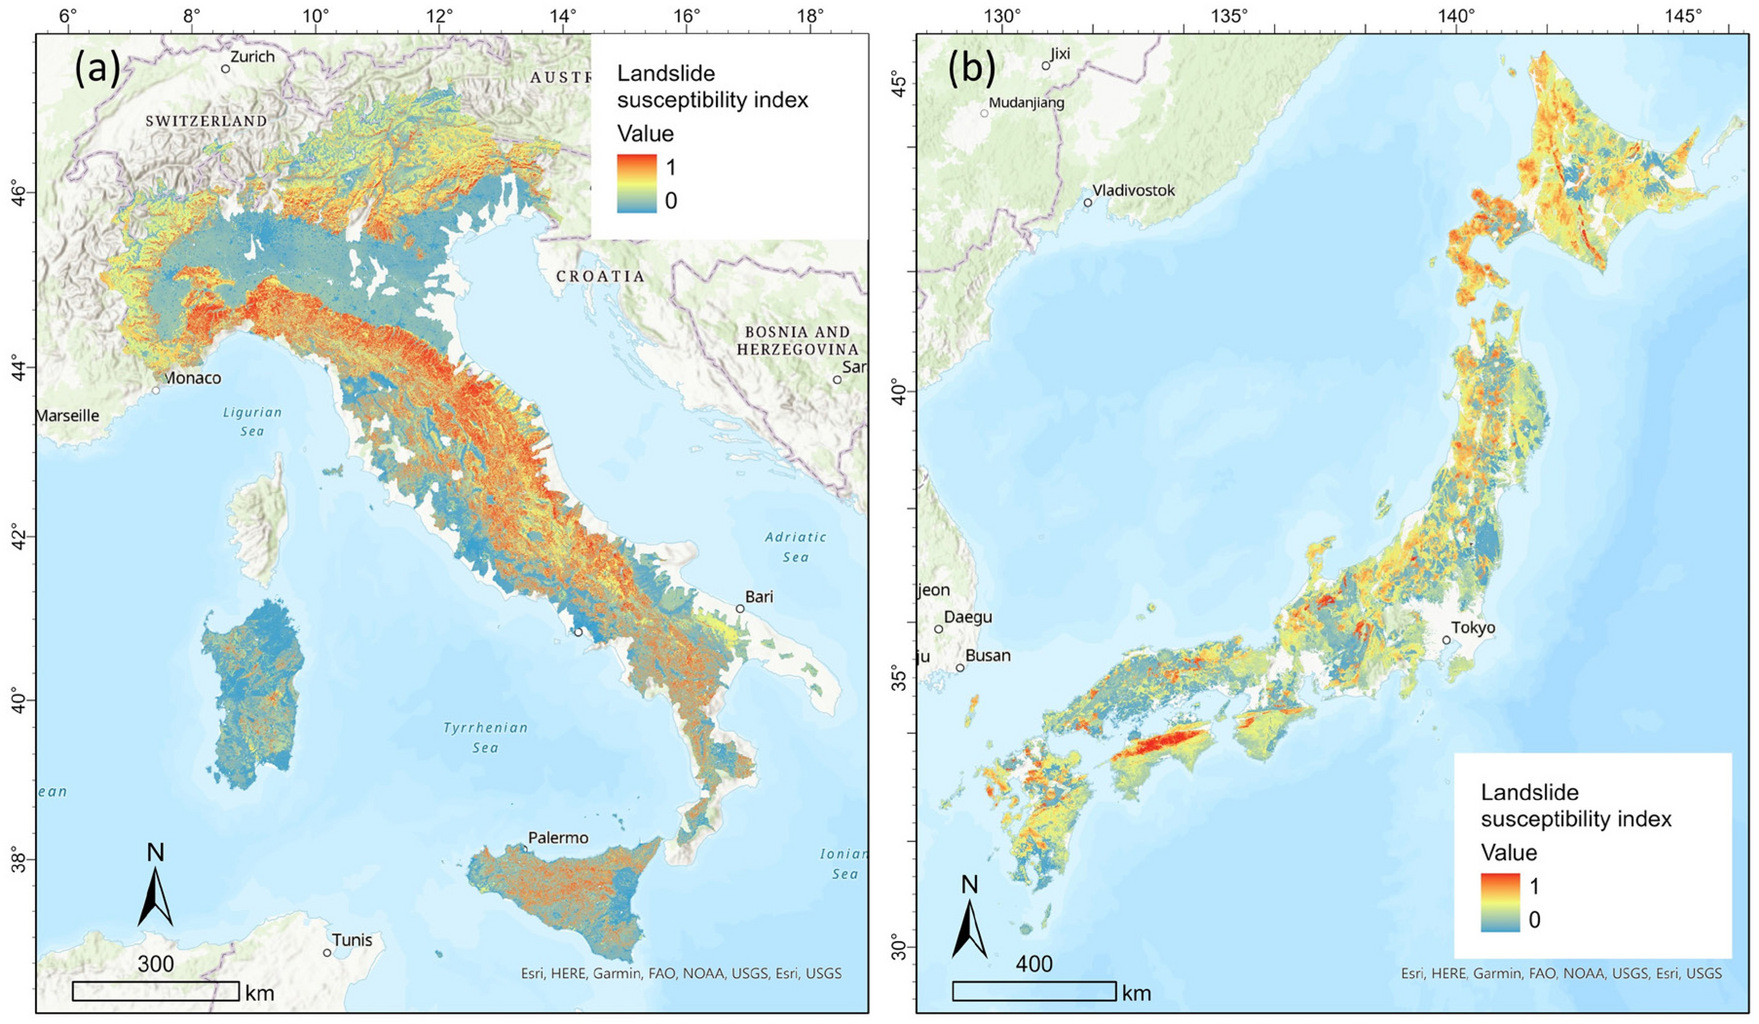
Fig. 6

Landslide susceptibility evaluation result in Italy (a) and Japan (b)
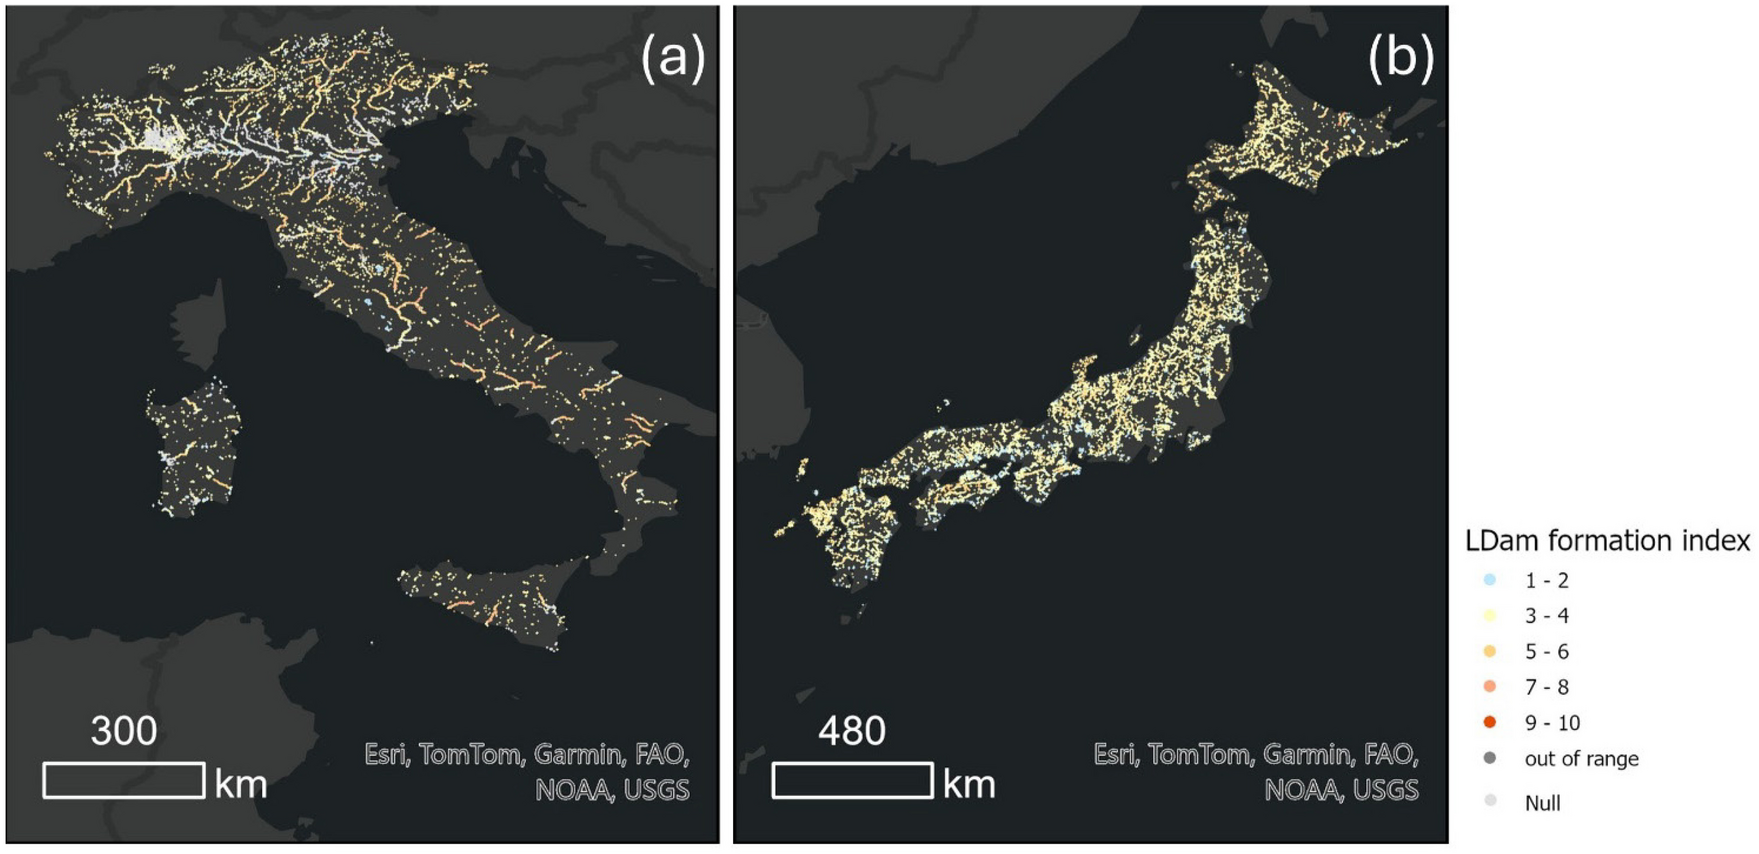
Fig. 8

Landslide dam formation index result in Italy (a) and Japan (b) (each dot with LDam formation index represented the centre of a river reach presented as 90-m resolution grid in MERIT Hydro; Figs. S1–8 in supplementary presents two instances of visualising the LDam formation index on a smaller scale)
内容や精度はともかく、「ひとまず全国やってみた」「使ったデータは公開したよ」という取り組み姿勢は素晴らしいと思います。日本の税金で整備したデータを他国の研究者が使用して成果を公開するという点に引っかかりがありますが、それも日本の研究者の刺激になれば良いでしょう。
*********************************
20241128追記
川幅は日本の方が作られた全球データを利用されています。落としてGISでプロットしてみましたが、粗くて途切れていました。上記のマップはかなり引いていますので、雰囲気を比べられる程度でしょうか。
0 件のコメント:
コメントを投稿